

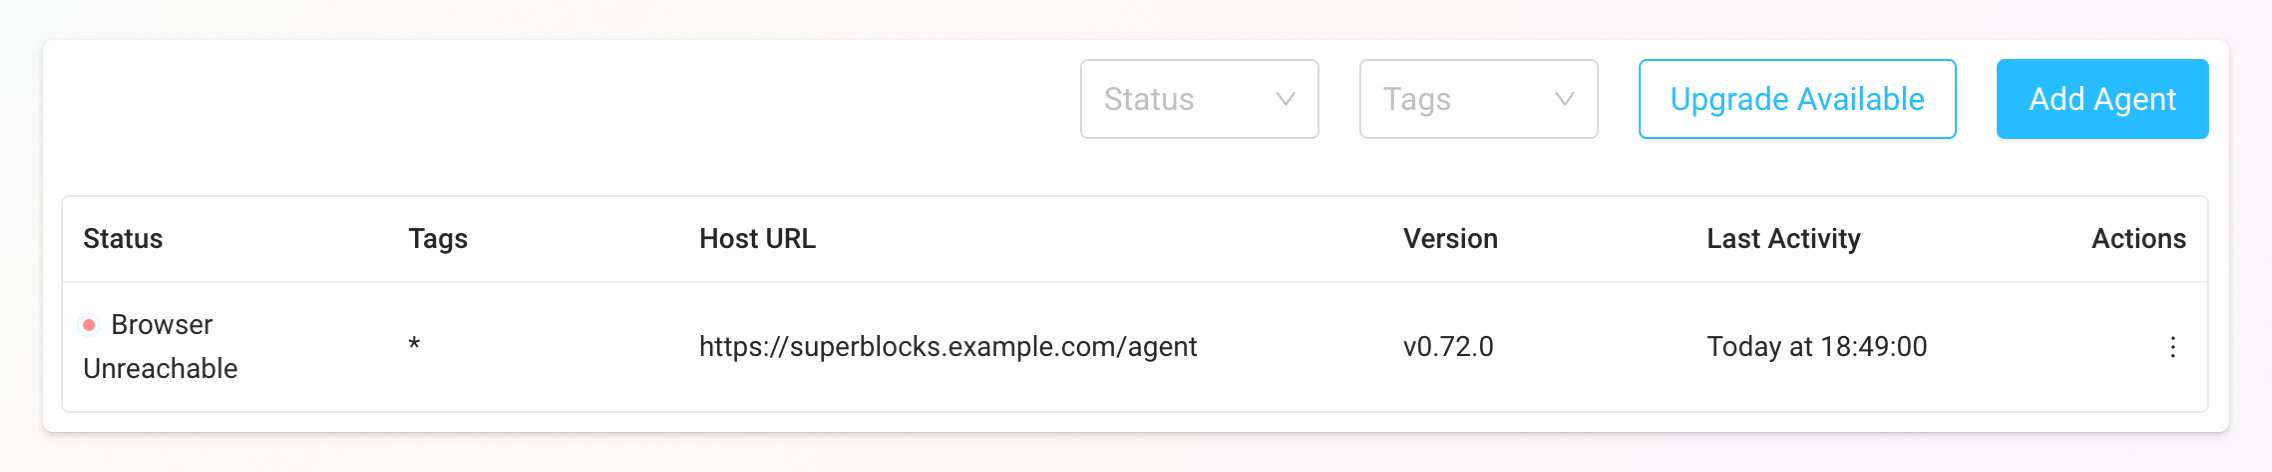
Browser Unreachable
The Browser Unreachable status can indicate a number of problems with your data plane configuration, but generally means there is a network issue between your browser and the Superblocks data plane. While the data plane can connect to Superblocks Cloud, your browser cannot connect to this data plane. Some quick points to check:- For non-localhost deployments, confirm that the data plane host URL is correct and exposed via HTTPS.
- If a VPN is required to access the data plane, check that you’re connected to the VPN on your device.
- Check the ingress and firewall configuration on your data plane deployment.
- If using the Brave browser, turn off the Shields for the Superblocks site.
- v1.x.x
- v0.x.x
GET https://<HOST_URL>/healthPOST https://<HOST_URL>/v2/execute/stream
Troubleshooting CORS issues
If you are using a proxy or service mesh in your data plane deployment, check if it’s populating the following CORS headers properly:- Access-Control-Allow-Credentials
- Access-Control-Allow-Headers
- Access-Control-Allow-Methods
- Access-Control-Allow-Origin
Disconnected
This status means the data plane cannot connect to Superblocks Cloud. Click the status in app to see more details. If the modal shows that your browser can connect to this data plane, then check the egress and firewall configuration on your data plane deployment to see if something is preventing it from reaching out to Superblocks. If the modal shows that your browser cannot connect to this data plane, then start by making sure your data plane service is running and healthy. For example,kubectl get pods -n superblocks to check if the data plane pods are running in Kubernetes, or docker ps | grep superblocks for a Docker deployment. Further inspect the logs/events for these services if they are not healthy.
data plane not appearing on data planepage
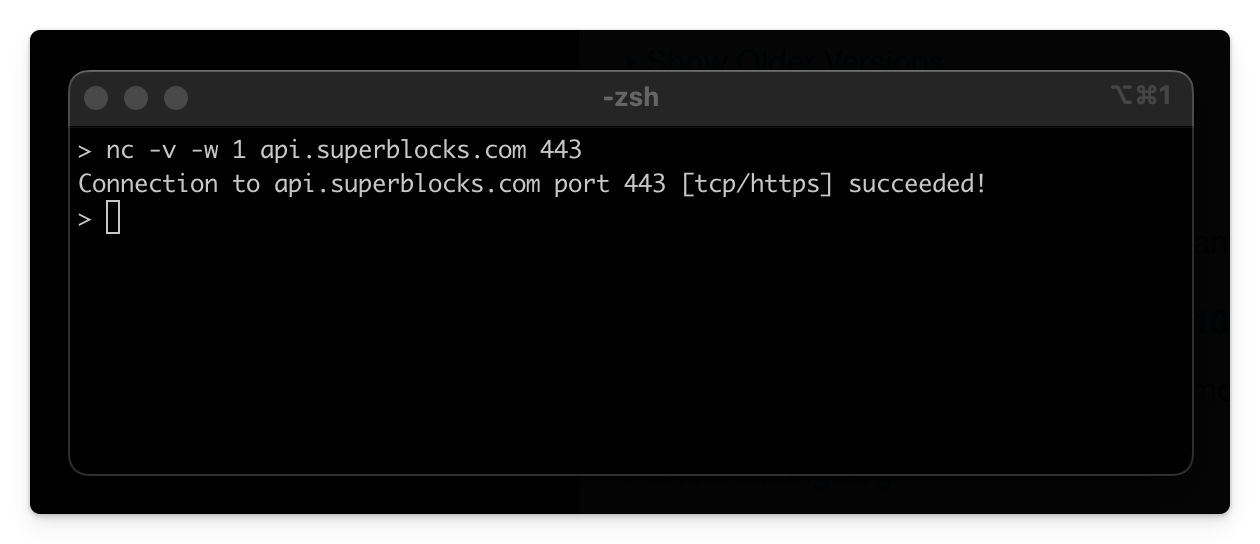
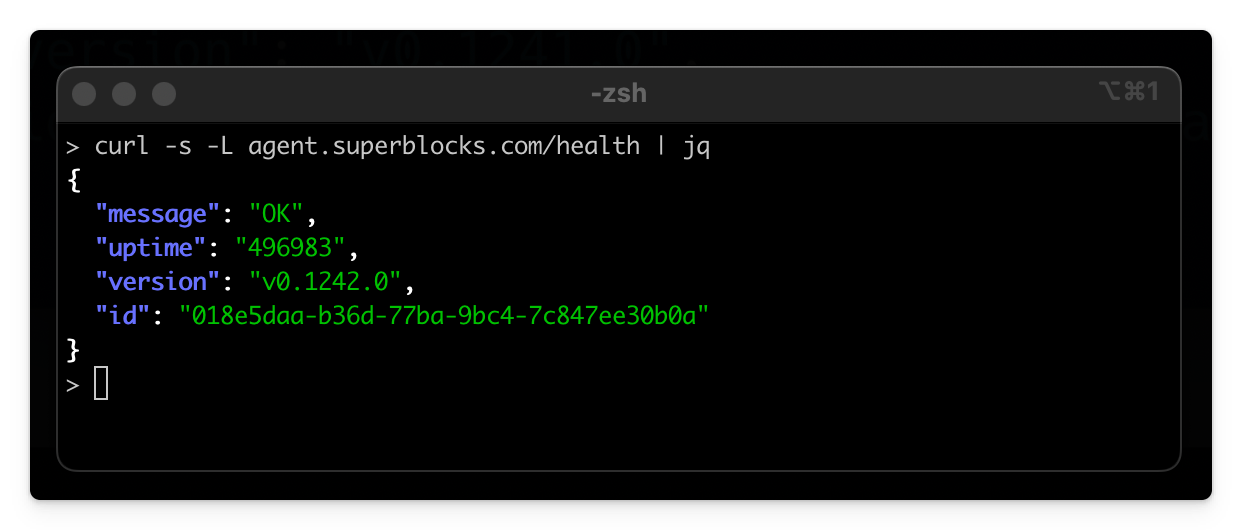
This occurs due to similar issues as the Disconnected error. The data plane is unable to reach the Superblocks control plane or edge cache to register itself. This error can also be caused by the data plane being in an unhealthy state as well. The best way to troubleshoot this issue is to verify that the network does not impede the data plane and that the data plane is healthy. Runnc -v -w 1 api.superblocks.com 443 from your data plane environment and run curl -s -L data plane.superblocks.com/health | jq from your local environment.
- Check Superblocks can reach control plane or edge cache(run this on the data plane environment):
- Check data plane is healthy(run this locally):
Queries timing out
If a connection times out from something upstream (for instance, an ELB) you may receive an error that says"Failed to connect". To fix this, ensure that the timeout set on the ELB is large enough to accommodate the queries that your applications are making.