> ## Documentation Index
> Fetch the complete documentation index at: https://docs.superblocks.com/llms.txt
> Use this file to discover all available pages before exploring further.
# Plan & Usage
> Walk through the Plan & Usage page: commitment bar, charts, checkpoint-level GAU spend, and deployed-app charges
**Plan & Usage** helps admins understand the ROI of Superblocks at a granular level: which builders and apps create the most value, what it costs to deliver a specific Clark outcome, and how published apps are used against your dollar commit.
Open **Organization Settings → Plan & Usage** (admins with billing access).
Concepts (GAUs, dollar commit, deployed apps) are on [Billing overview](/admin/billing-overview). Limits and alerts are on [Spend management](/admin/spend-management).
This is the experience for customers with a dollar commit with Superblocks. If your organization has a special contract, usage is shown in GAUs instead of dollars in the commitment summary, the usage chart, the usage table (including checkpoint rows), and the deployed applications view.
 ## Commitment and plan summary
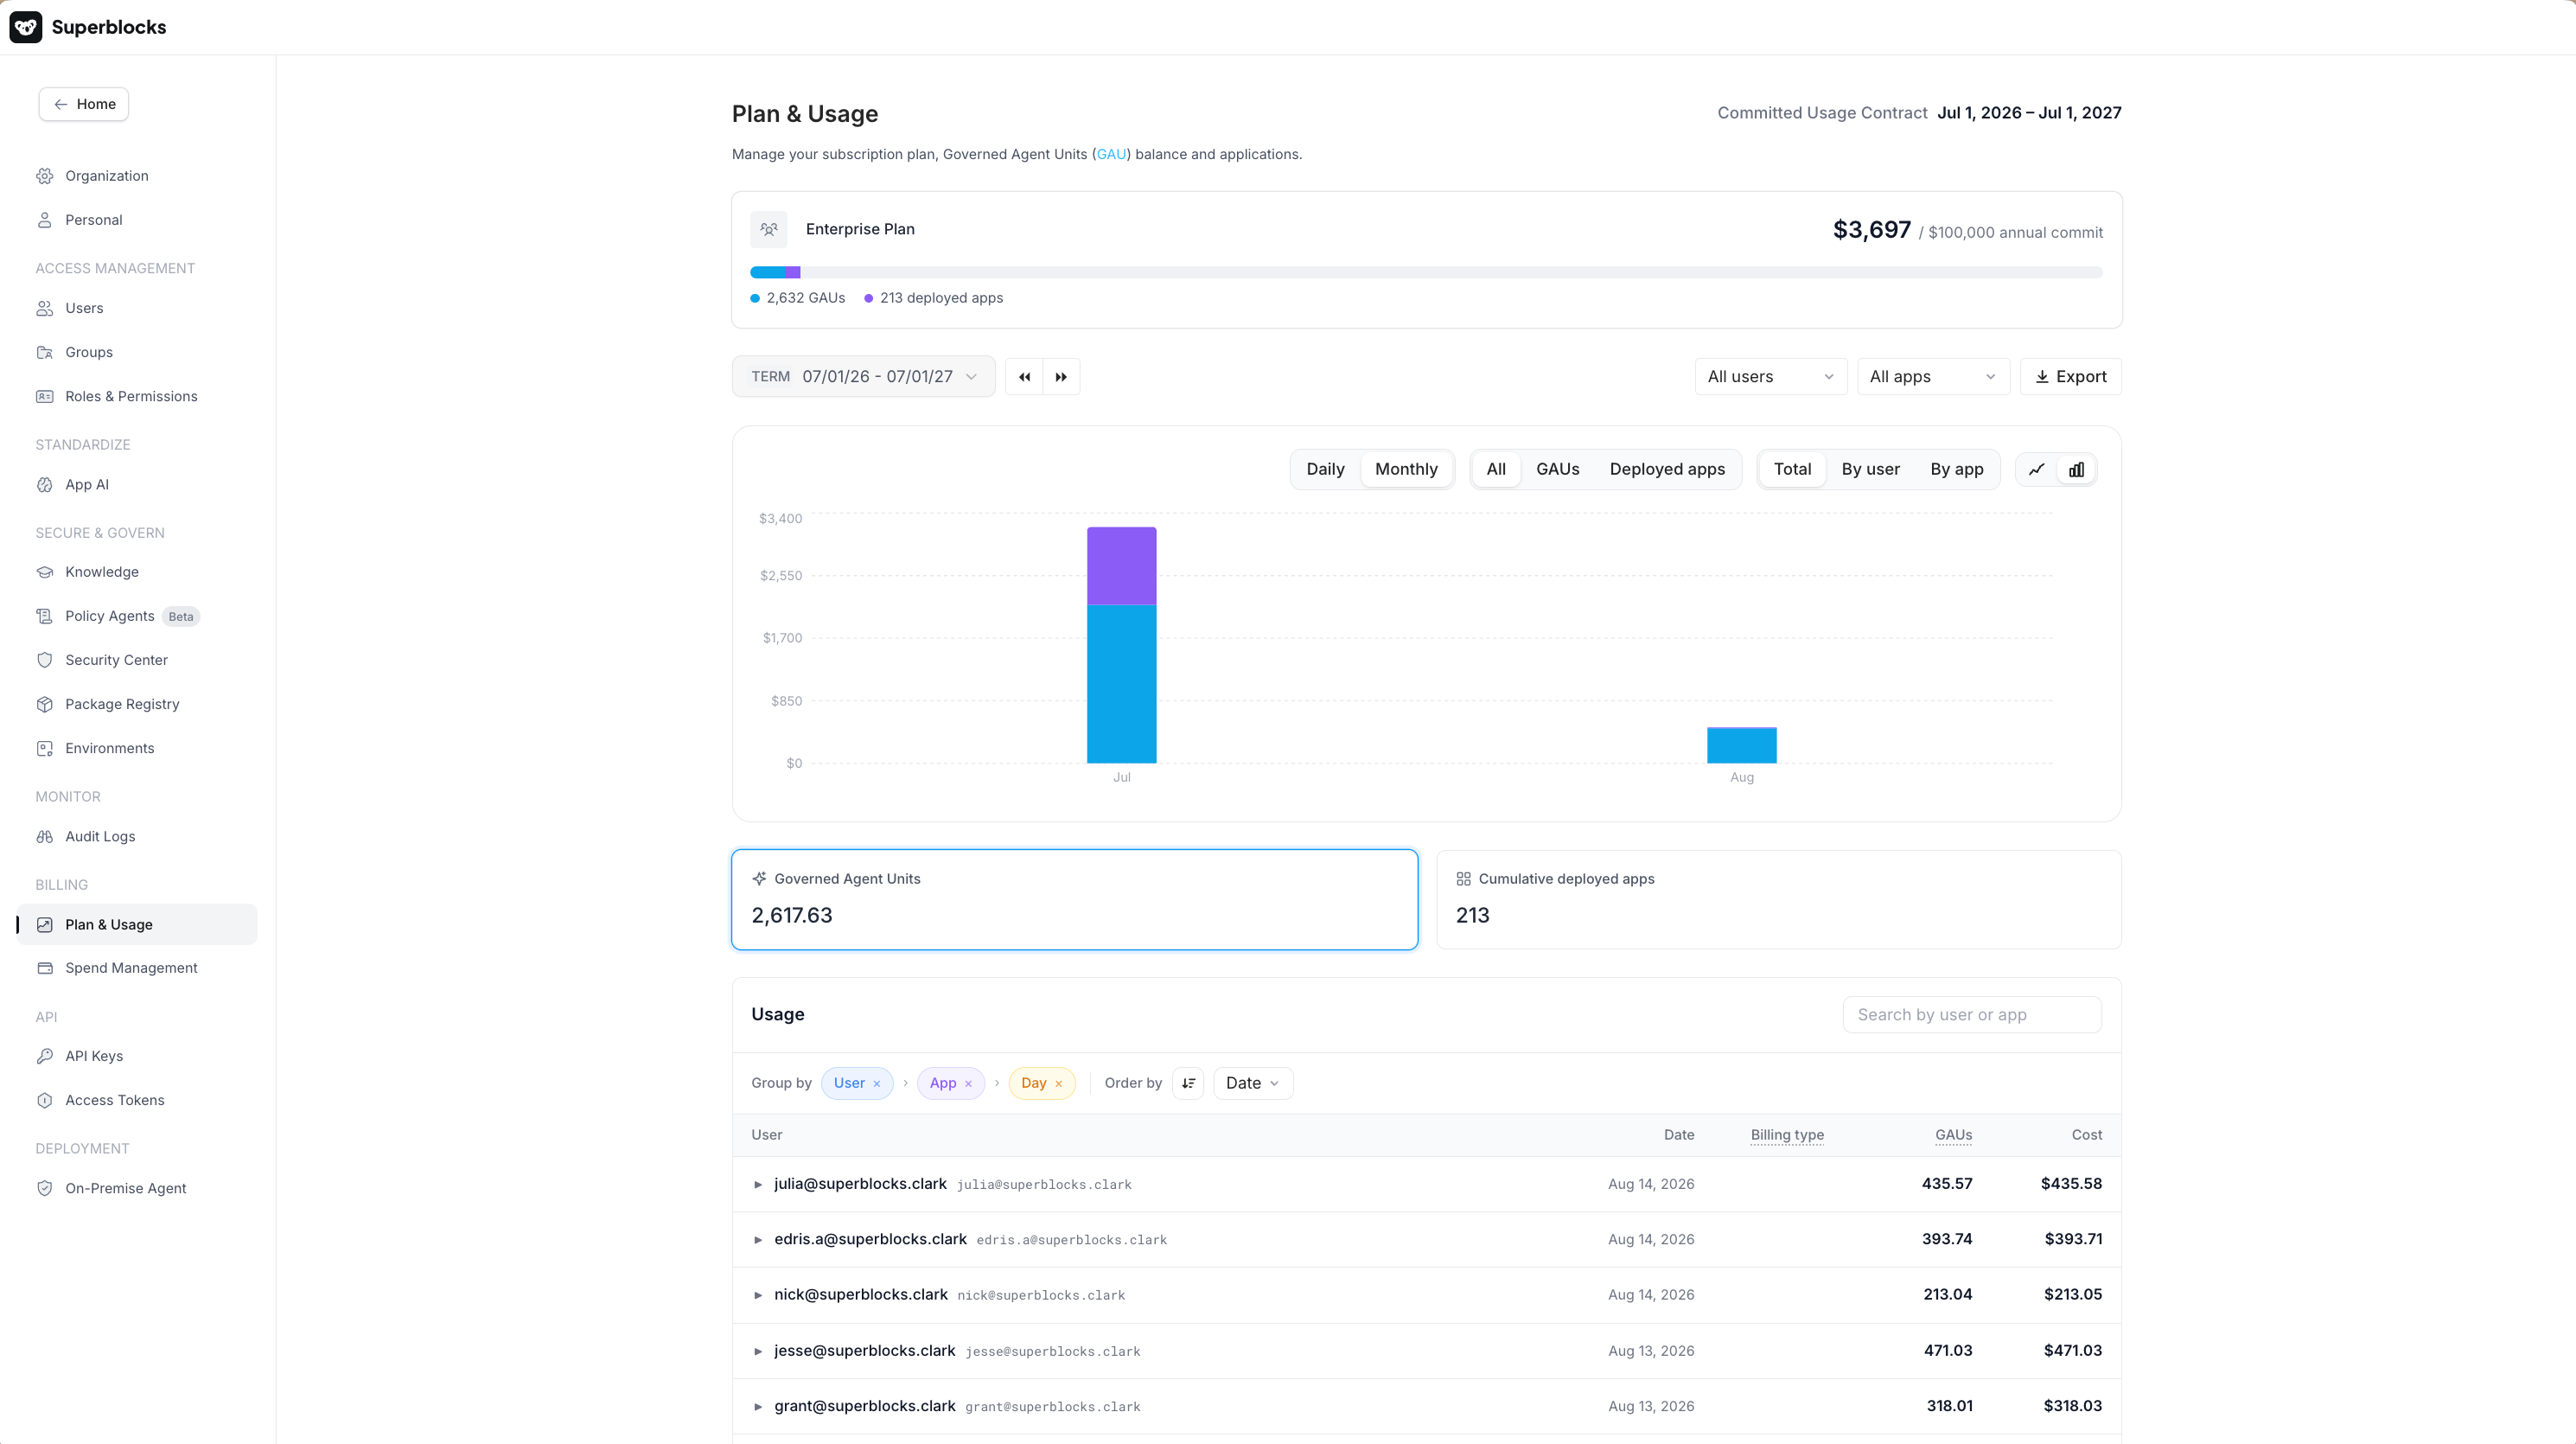
At the top of the page, the plan summary shows your contract period and how consumption tracks against your dollar commit.
The **commitment / usage bar** summarizes Clark (GAU) and deployed-app usage for the current commit cycle, so you can see how the value you are getting maps to your committed spend.
## Commitment and plan summary
At the top of the page, the plan summary shows your contract period and how consumption tracks against your dollar commit.
The **commitment / usage bar** summarizes Clark (GAU) and deployed-app usage for the current commit cycle, so you can see how the value you are getting maps to your committed spend.
 ## Filters, date range, and chart
Use the filter bar to focus the chart and tables on the work that matters:
* **Date range** (for example Current Month, Contract Period, or previous-month presets)
* **User** and **App** filters
* **Export** for CSV download of the current usage view
Daily usage is aggregated in UTC.
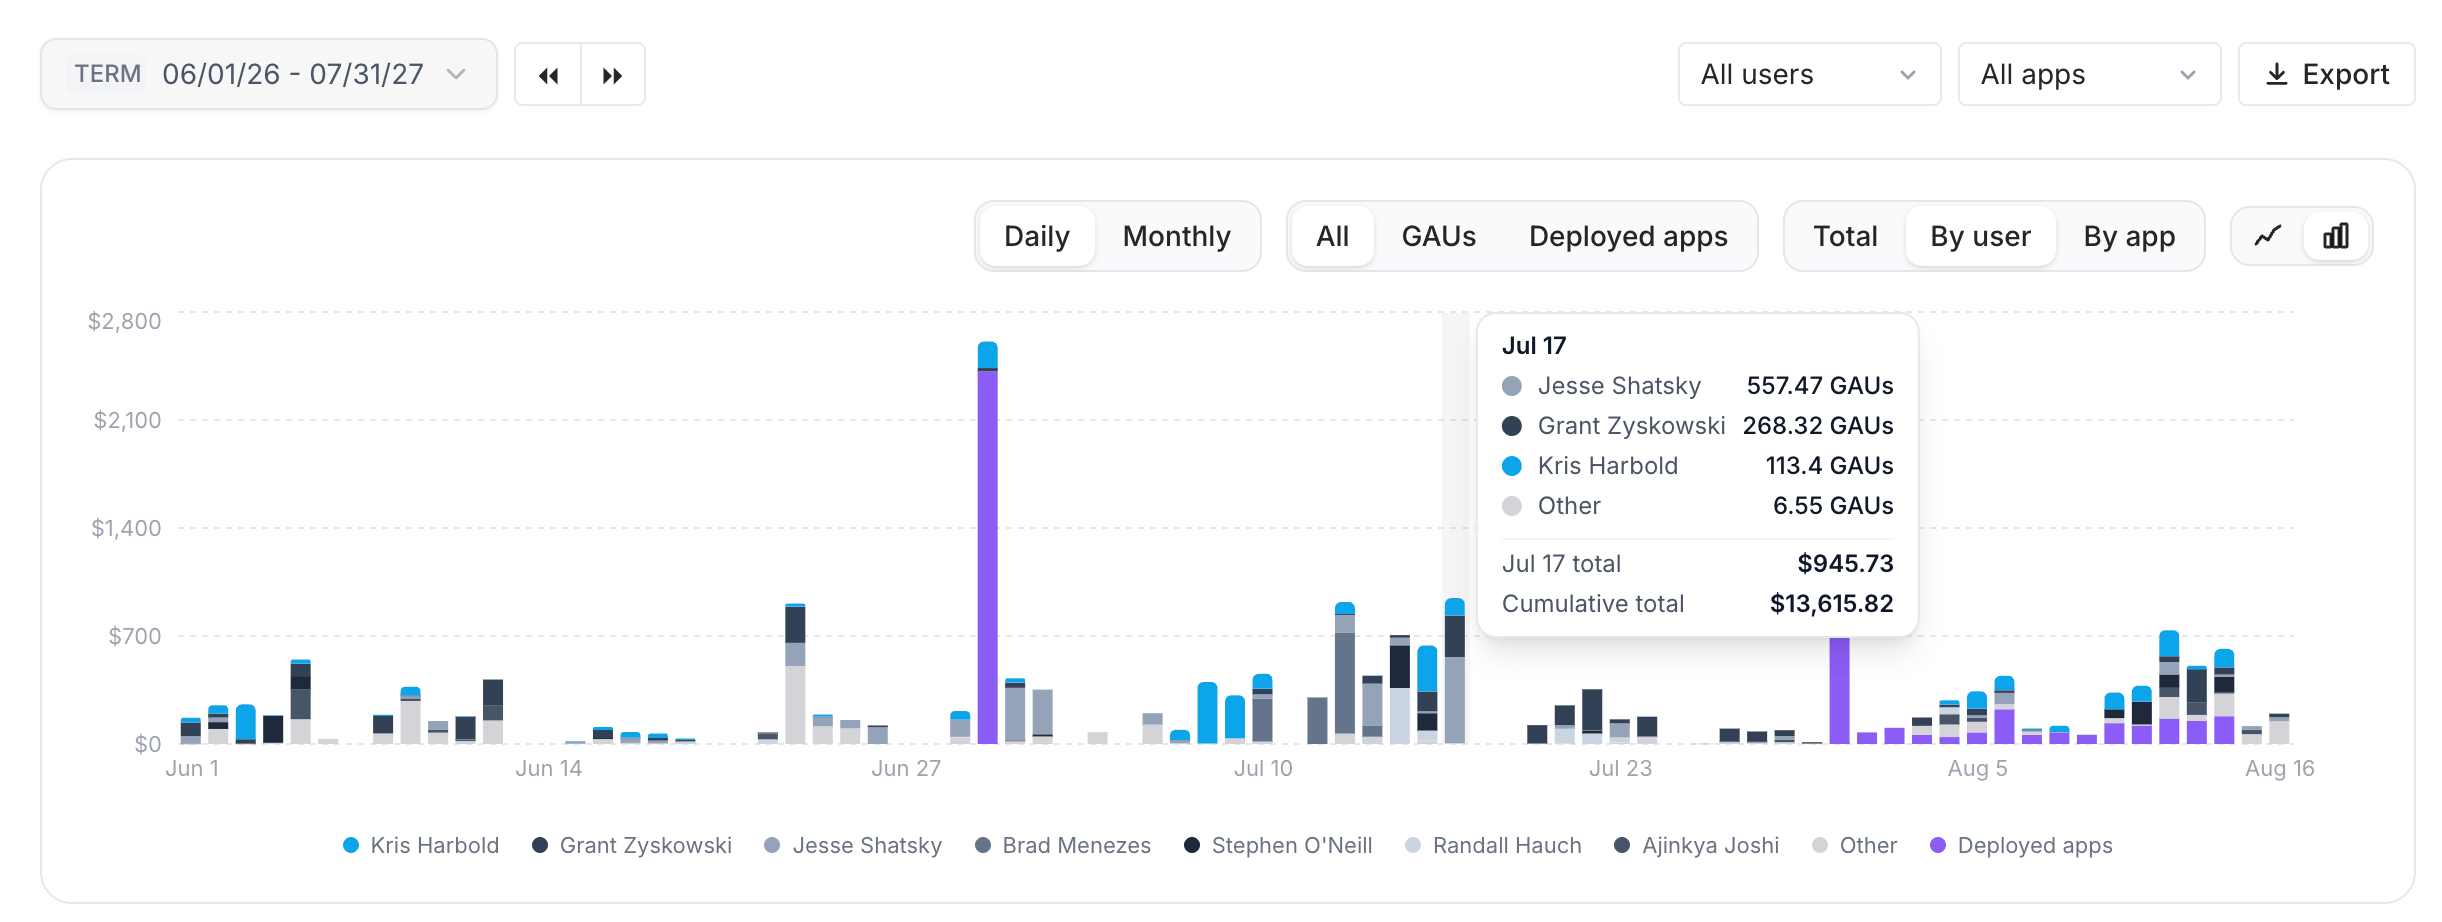
The chart shows how usage and value break down over time. You can filter by SKU (**All**, **GAUs**, **Deployed apps**), group (**Total**, **By user**, **By app**), and choose **Daily** or **Monthly** granularity.
## Filters, date range, and chart
Use the filter bar to focus the chart and tables on the work that matters:
* **Date range** (for example Current Month, Contract Period, or previous-month presets)
* **User** and **App** filters
* **Export** for CSV download of the current usage view
Daily usage is aggregated in UTC.
The chart shows how usage and value break down over time. You can filter by SKU (**All**, **GAUs**, **Deployed apps**), group (**Total**, **By user**, **By app**), and choose **Daily** or **Monthly** granularity.
 ## Usage table and group by
Select the **Shared GAUs** (or equivalent shared spend) resource tile to open the usage table.
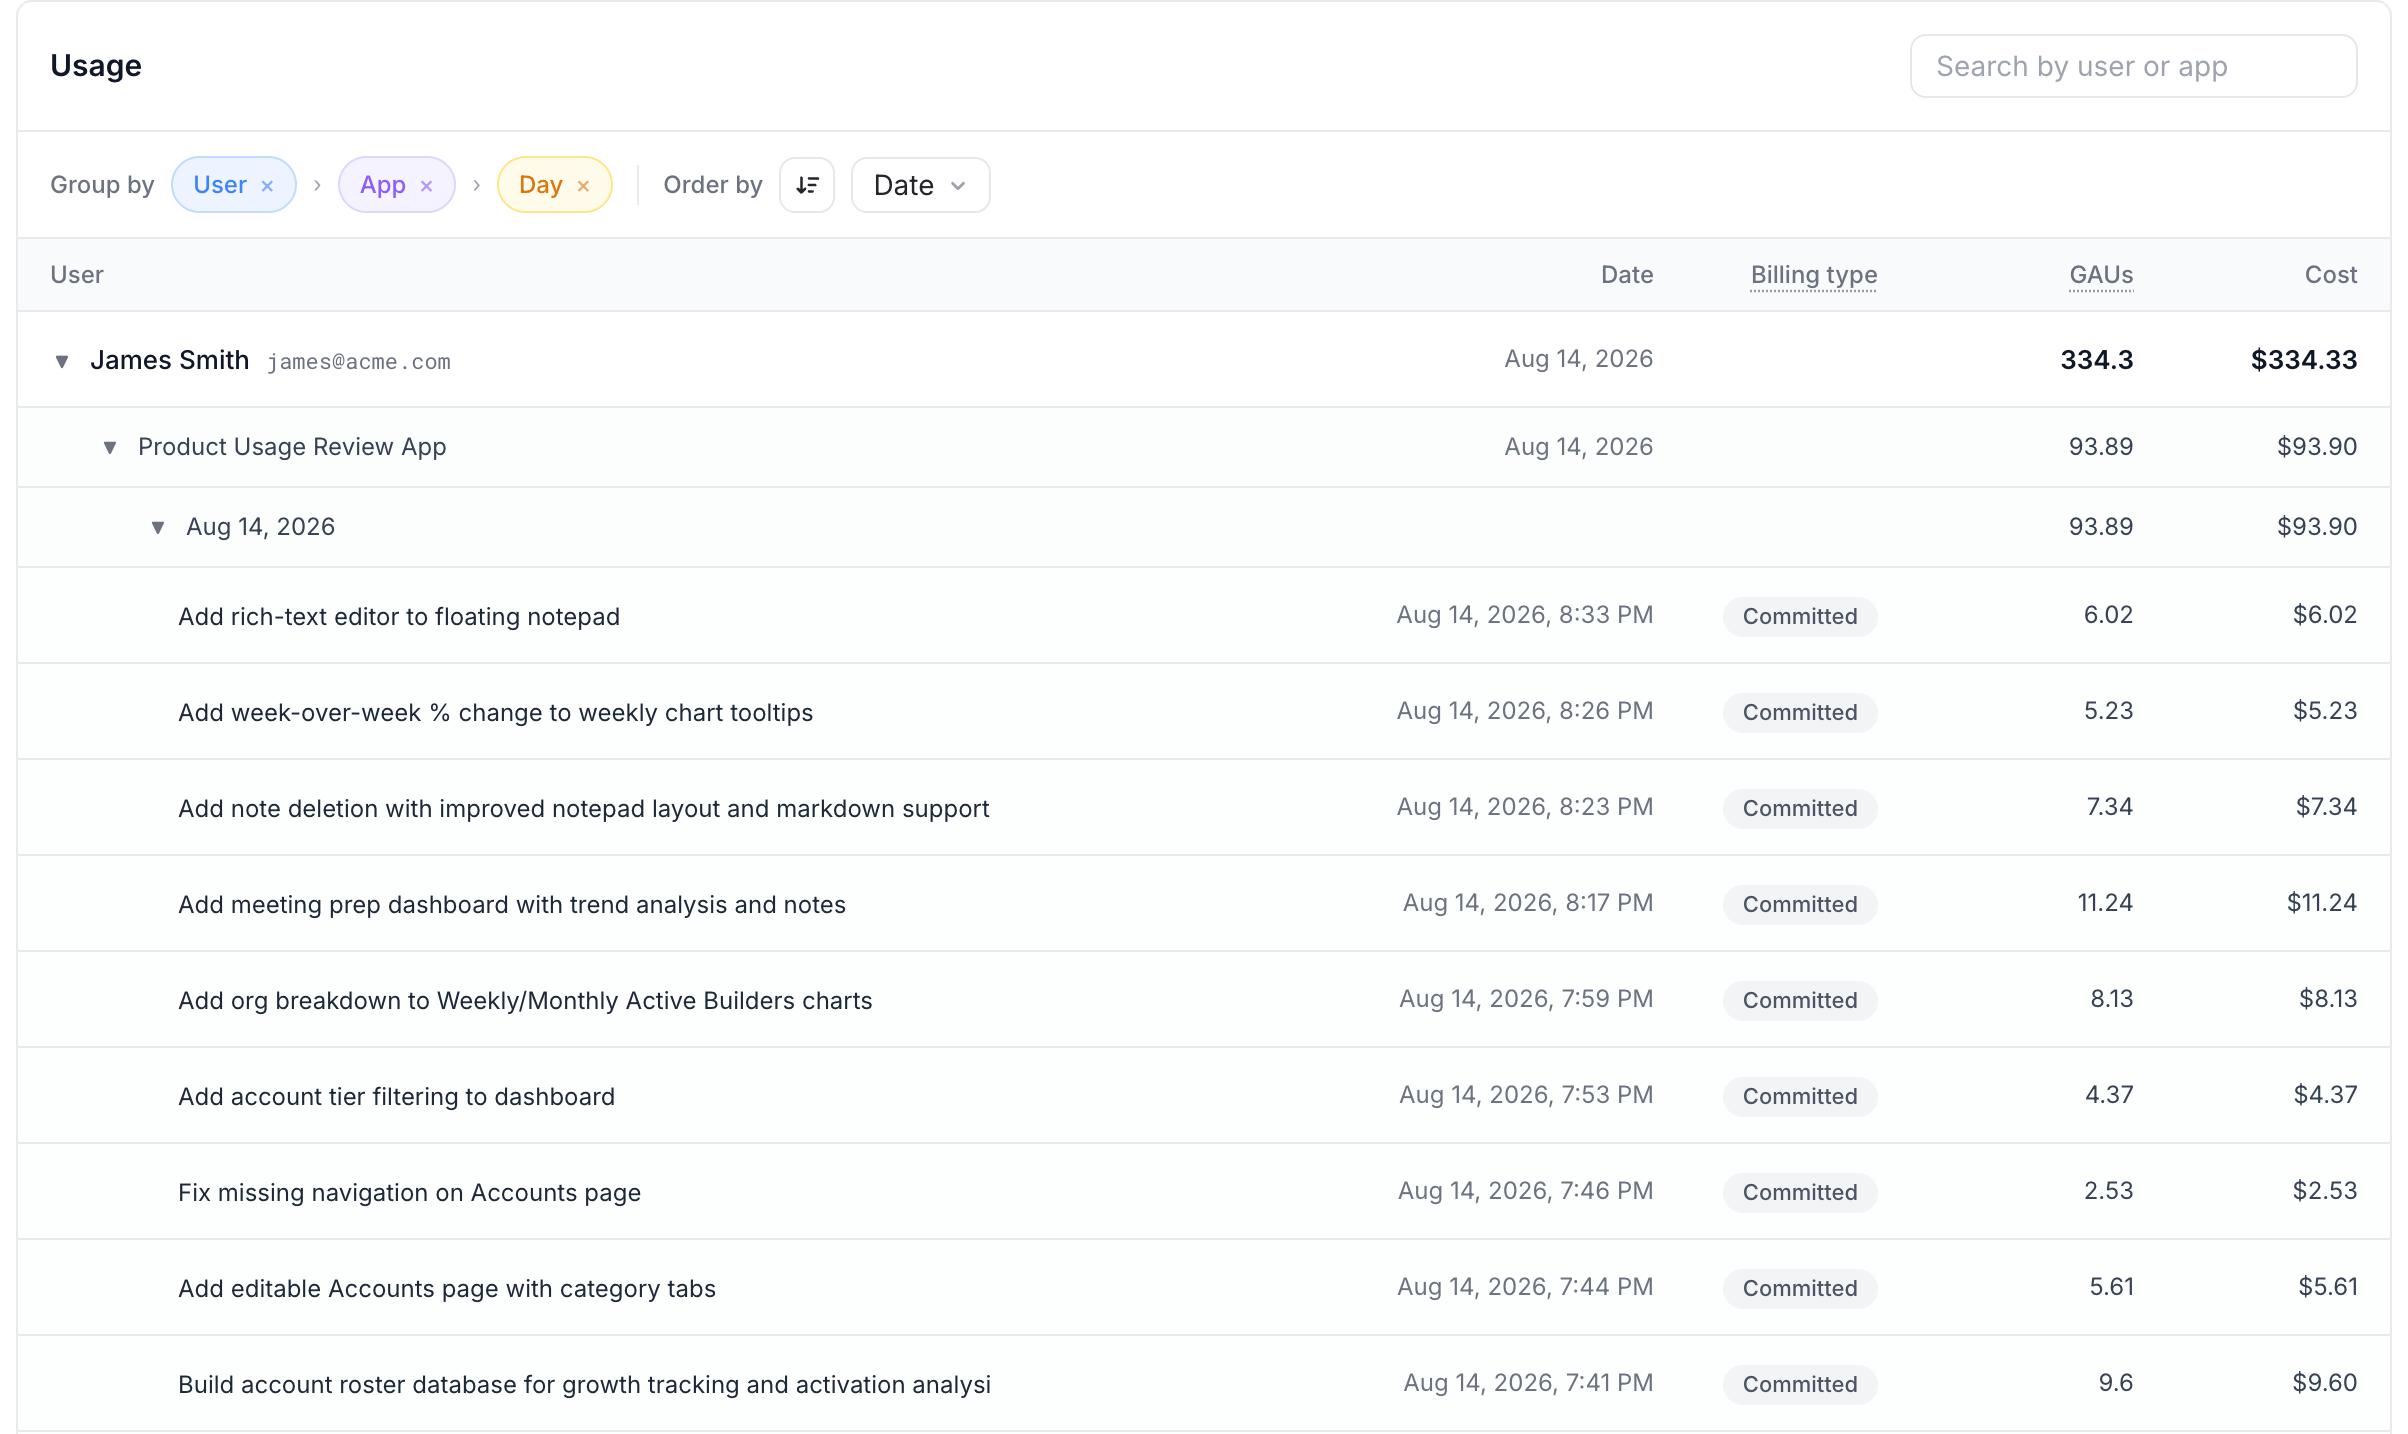
**Group by** lets you nest rows by **User**, **App**, and **Day** (any combination, reorderable). Use this to see which people, apps, and days deliver the highest-ROI work.
## Usage table and group by
Select the **Shared GAUs** (or equivalent shared spend) resource tile to open the usage table.
**Group by** lets you nest rows by **User**, **App**, and **Day** (any combination, reorderable). Use this to see which people, apps, and days deliver the highest-ROI work.
 ### Checkpoint-level rollup
GAU usage rolls up to the relevant **Clark checkpoint** (an accepted set of AI changes), not to each individual prompt. Expand a group to see checkpoint rows with:
* Checkpoint label (or a fallback such as "User accepted AI changes")
* Date and time
* Cost (dollars on dollar-commit)
* Billing type when shown (**Committed** or **Overage**)
That is how you connect spend to a concrete outcome: what it took to ship a specific change with Clark.
Usage that is not tied to an accepted checkpoint (for example work that was never accepted, or usage recorded before checkpoint tracking) can appear under a **No checkpoint** aggregate within the group. Group totals still include that usage.
## Deployed applications
Select the **Deployed Apps** resource tile to open the deployed applications statement.
Each row is an app for a billed month and can include:
* App name and creator
* **Months billed** (current month may be marked as of today)
* **Billing type**, including **Pending** for a deployed app that will be charged when the month closes
* Views (when available)
* Cost
Use this view to see which published apps are in production, how they are used, and how that usage maps to your commit, including charges that are still pending for the current month.
## Related
* [Billing overview](/admin/billing-overview) — GAUs, dollar commit, and deployed-app concepts
* [Spend management](/admin/spend-management) — limits, alerts, and refills controls
* [Self-serve plans](/admin/self-serve-plan) — Teams packs and GAU refills
### Checkpoint-level rollup
GAU usage rolls up to the relevant **Clark checkpoint** (an accepted set of AI changes), not to each individual prompt. Expand a group to see checkpoint rows with:
* Checkpoint label (or a fallback such as "User accepted AI changes")
* Date and time
* Cost (dollars on dollar-commit)
* Billing type when shown (**Committed** or **Overage**)
That is how you connect spend to a concrete outcome: what it took to ship a specific change with Clark.
Usage that is not tied to an accepted checkpoint (for example work that was never accepted, or usage recorded before checkpoint tracking) can appear under a **No checkpoint** aggregate within the group. Group totals still include that usage.
## Deployed applications
Select the **Deployed Apps** resource tile to open the deployed applications statement.
Each row is an app for a billed month and can include:
* App name and creator
* **Months billed** (current month may be marked as of today)
* **Billing type**, including **Pending** for a deployed app that will be charged when the month closes
* Views (when available)
* Cost
Use this view to see which published apps are in production, how they are used, and how that usage maps to your commit, including charges that are still pending for the current month.
## Related
* [Billing overview](/admin/billing-overview) — GAUs, dollar commit, and deployed-app concepts
* [Spend management](/admin/spend-management) — limits, alerts, and refills controls
* [Self-serve plans](/admin/self-serve-plan) — Teams packs and GAU refills